I’ve been reading Chris Anderson’s latest book “Free” the last couple of weeks and it reminded me of an article I once read singling out the words ‘New’ and ‘Free’ as the two most effective words in marketing. Not too surprising but interesting nonetheless.
Alongside ‘New’ and ‘Free’ there’s another well known device that I do find surprising in its affect – the power of popularity. I’m talking about the pulling power of the ‘Nation’s favourites’, the ‘9 out of 10 prefers’ and the ‘People’s favourites’. Amidst current fascinations with herd behaviour I still struggle to believe that, in today’s individuality fuelled world, being the same as everybody else is so attractive. Whatever happened to the likes of Nike iD and so on?
Sure, there are plenty of examples of people following suit once a precedent has been set (a brilliant example is Matthew Salganik’s experiment involving the selection of music from lists with and without knowledge of previous participants’ choices. He found that as social influence increased – when participants could see what others had chosen – the popularity of songs became dependant more on previous choices than on quality. The full article is here) but I’m still surprised that such a simple statement can have such an effect. Especially when readers/listeners cannot tangibly see how the stat has been formed.
Is it a confidence thing? A safe bet? It’s well attested that we live in a loss averse society (eg we put a higher price on losing something than we do in gaining) so does it work because we’re scared to challenge the masses? A lot of purchase behaviour is confidence-based after all. From brand trust all the way through to Zappos offering free postage on online returns to alleviate the fear of ordering the wrong size clothes and getting stung for sending them back.
Or is it more about indecision and tipping points? Drowning in a plethora of choice following suit is an easy option. It gives a reason to get off the fence. If it’s good enough for everybody else then it must be fine for me. On a shelf full of over-scienced fluoride cleaning, whitening and enamel hardening a popular choice brings clarity to choosing actoothpaste. Conversely, we never know how much is appropriate to give to charity. The ability to see previous donations by friends on JustGiving makes it a lot easier.
Or is it just laziness? As the economist Nick Szabo points out even purchasing an item worth a penny carries a ‘mental transaction cost’, the value placed on the “is it worth it/isn’t it worth it” thought. There’s less thought needed if you tap into your herd instincts and follow suit. If there’s an option to take the least path of resistance then we’ll take it. We’ve got plenty of other stuff to think about, just follow suit and brain power’s saved.
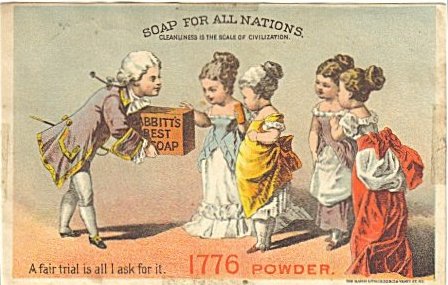
Whatever the reason it’s obviously effective, from BA’s “The Nation’s Favourite” to Benjamin Babbitt’s “get on the bandwagon” used way back in the mid-19th century (he also gave “for all nations” a go as well). I guess we all want to be different enough to stand out but need to feel average enough to be normal.
Whatever the reasoning, 1 out of 1 Simons can’t help but feel a little disappointed in the lack of free thinking on this one.
Monday, 31 August 2009
8 Out of 10 Cats


Thursday, 26 February 2009
Visualising the Geek Within
One of the things I enjoy most about the planning department at Weapon7 is the fact that all the planners sit together – account planners alongside data and social media planners. All with a wide mix of experience and working on a variety of accounts across the agency, sometimes independently and often together. But before I get too happy families it’s worth pointing out that there is one tiny drawback: it turns you into an absolute geek.
My current ‘geekism’ is Data Visualisation (damn data planners).
It all started innocently with a light reading of Edward R Tufte’s “The Cognitive Style of PowerPoint: Pitching Out Corrupts Within” (OK, it does sound very plannery but any man who can quote Jas Elsner’s “Imperial Rome and Christian Triumph” in one sentence before summarising Lincoln’s Gettysburg Address in six slides deserves a look in my book). Then, before I knew it, I had blogs like ‘Analytics Arbitrage’ and ‘Extreme Presentation' infiltrating my iGoogle.
I just can’t help myself – I’m fascinated with cool ways of visualising data. Give a boy with a hint of OCD the chance to see the frequency and typology of “I need” phrases on twitter using a zoomable decision tree and, well, there goes the afternoon. I’m hooked. I’m like a kid with one of those ‘Magic Eye’ books from the 90s.
There is some (post-rationalised) method in the obsession though. Planners often muse that there’s insight in even seemingly meaningless bits of information - you've just got to find them.
These smart visualisations force you to look at data in new and engaging ways that allow these lovely info nuggets to shine. They bring the hidden to the fore, the ignored to the centre of attention and the meaningless to the front of mind. And, if you consider the amount of snippets of data left behind on digital media by people everyday and you've got yourself a galactic starscape of insight waiting to be found through a visualising click, zoom, drag, twist or twirl. Brilliant.
Here’s what I’m particularly hooked on at the moment:
BBC’s Britain from Above (especially the plane one),
Watching the Growth of Walmart across America from 1962 (if you zoom out too far the US looks pretty scary),
The Ebb and Flow of Movies – Box Office Receipts 1986-2008,
Great little video of the role of data day to day (and a good tune too),
A Visual Guide to Where Federal Tax Dollars Go.
Before I have to forcibly end this latest obsession I should probably have a stab myself. So here’s my final homage to data planning:


 Posts